

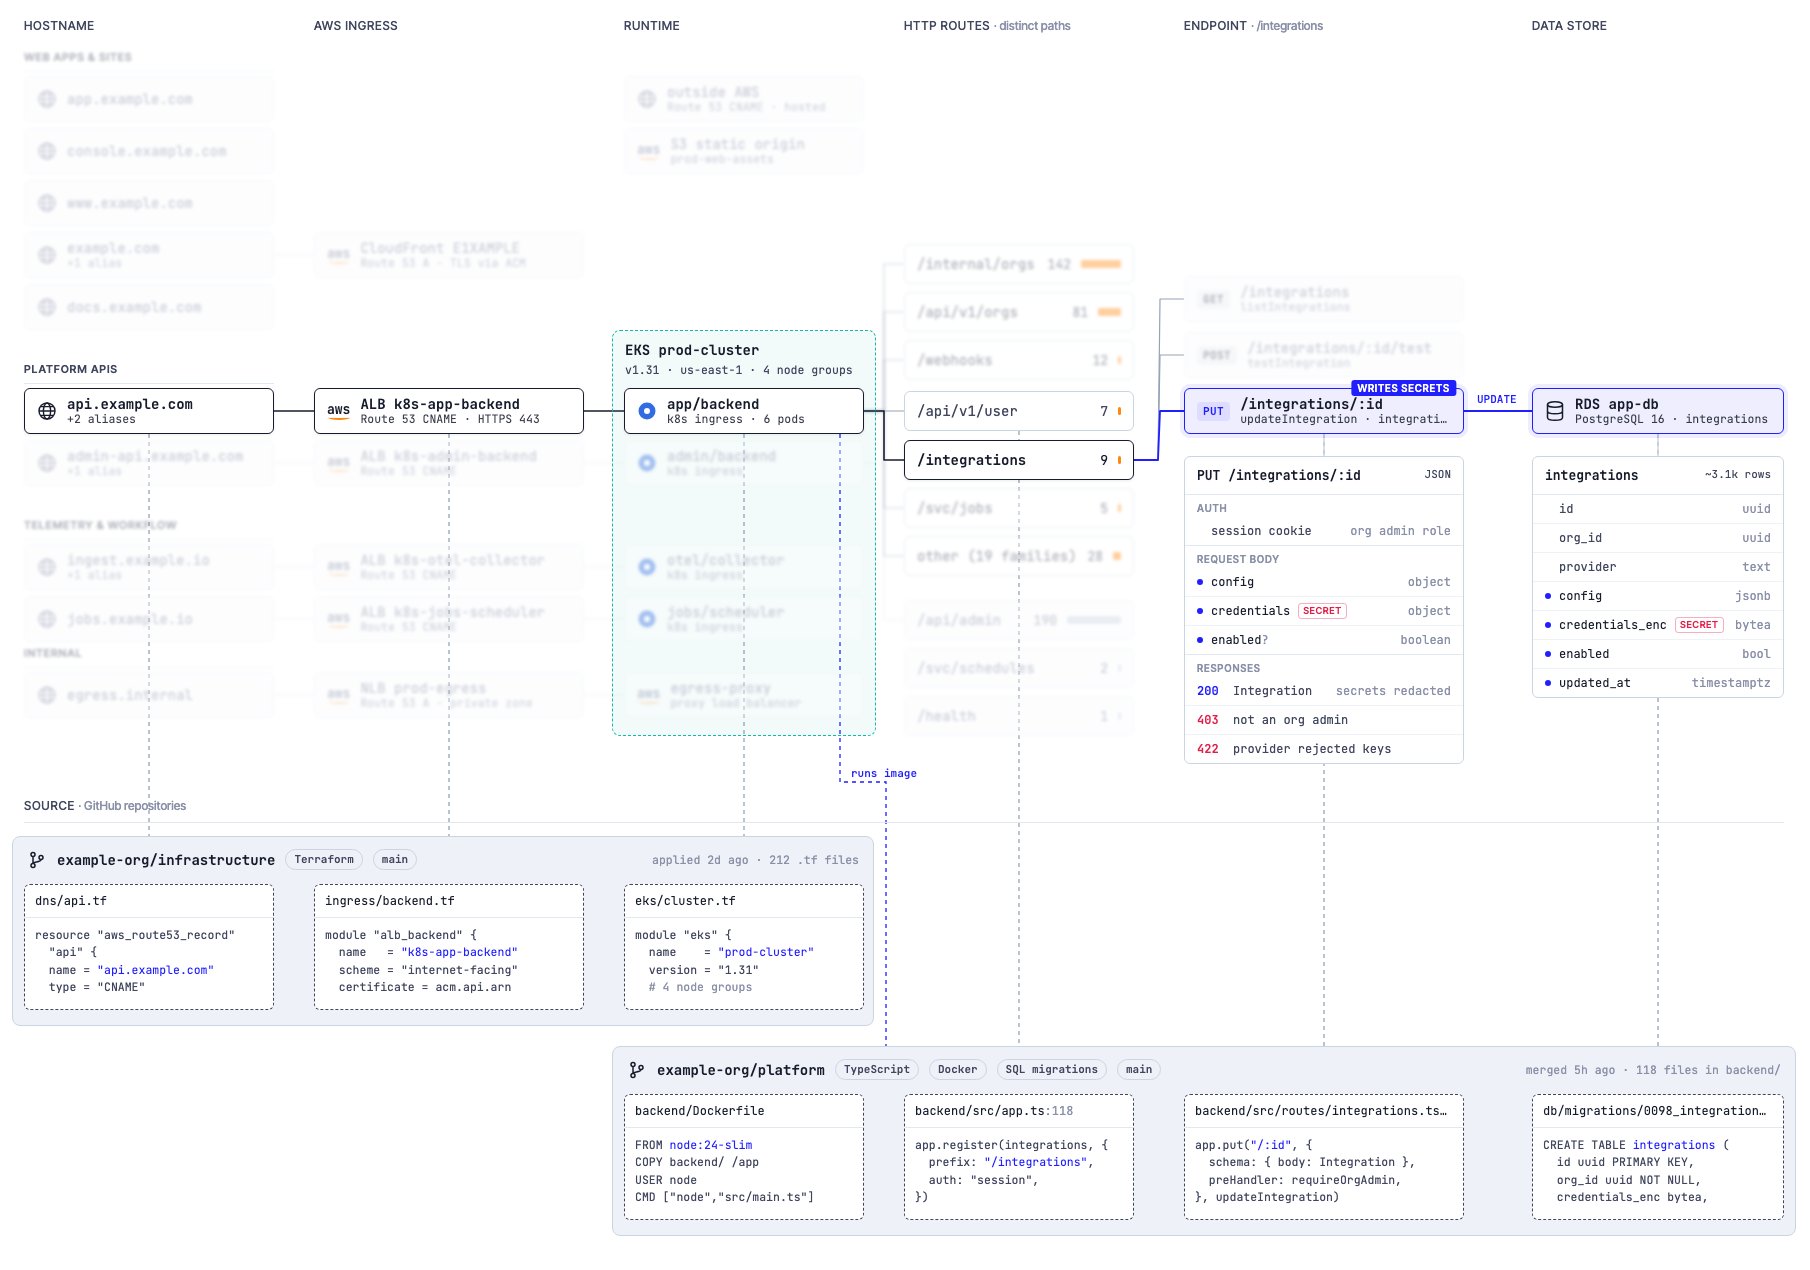
One path through the graph. A hostname goes to a load balancer, a cluster, an HTTP route, an endpoint, and a database. The graph links each step to the source file that defines it.
Contents of the graph
Each integration that you connect adds data to the same graph. The integrations catalog shows the sources of the graph.
How Tolmo finds changes
Each node and each edge has two timestamps:firstSeenAt: the time when Tolmo first saw it.lastSeenAt: the time when Tolmo last confirmed that it exists.
How the agents use the graph
Each run of the Red team agent starts from the current graph. The next run includes new hosts and endpoints under your authorized domains. Nobody must update a target list. Findings also use the graph. A finding links to the related application, endpoint, and code. Thus, you can see the affected resources and their owners. The HTTP endpoints view also uses the graph. It shows the routes that the agents tested and the routes that they did not test. The graph also limits testing. If a route is not in the graph, recon must find the route in the running application or in the source code.Use the graph
Explore in the app
Browse apps, endpoints, datastores, domains, and the full graph.
Time machine
See the resources that appeared or disappeared in a time window.
SQL and Cypher
Query the graph and your findings directly.
Connected services
Query GitHub, AWS, Datadog, and other sources through Tolmo.