

- The Mission Control activity feed.
- Agent Runs, the history of all agent runs.
Mission Control: the activity feed
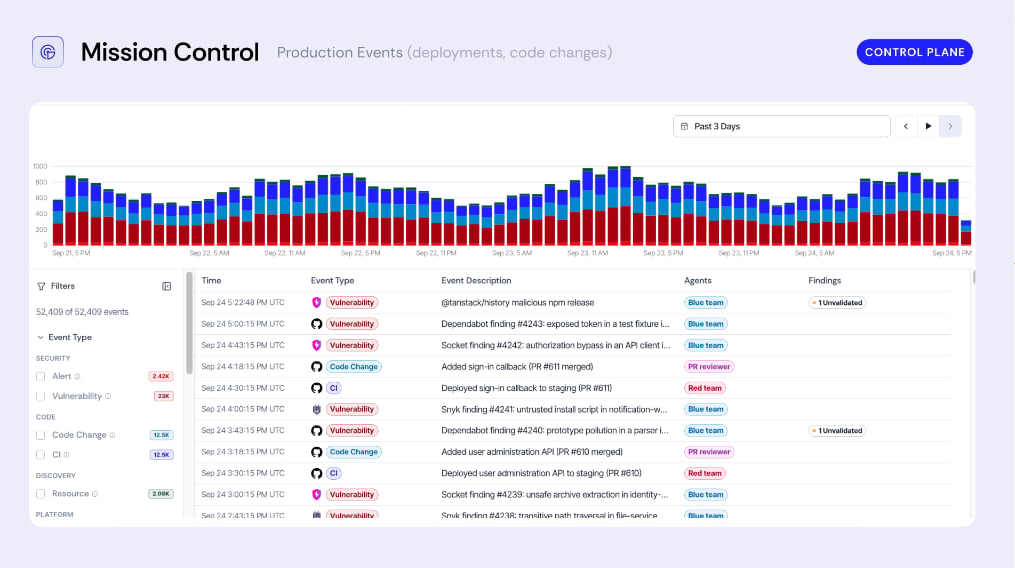
Mission Control. The histogram shows production events over time. Each row shows one event, the agents that work on it, and its findings.
- a new finding or an alert from a connected tool
- a code change or a CI event
- a new or changed compute, datastore, network, identity, or secret resource
Agent runs
Agent Runs shows all runs of all agents.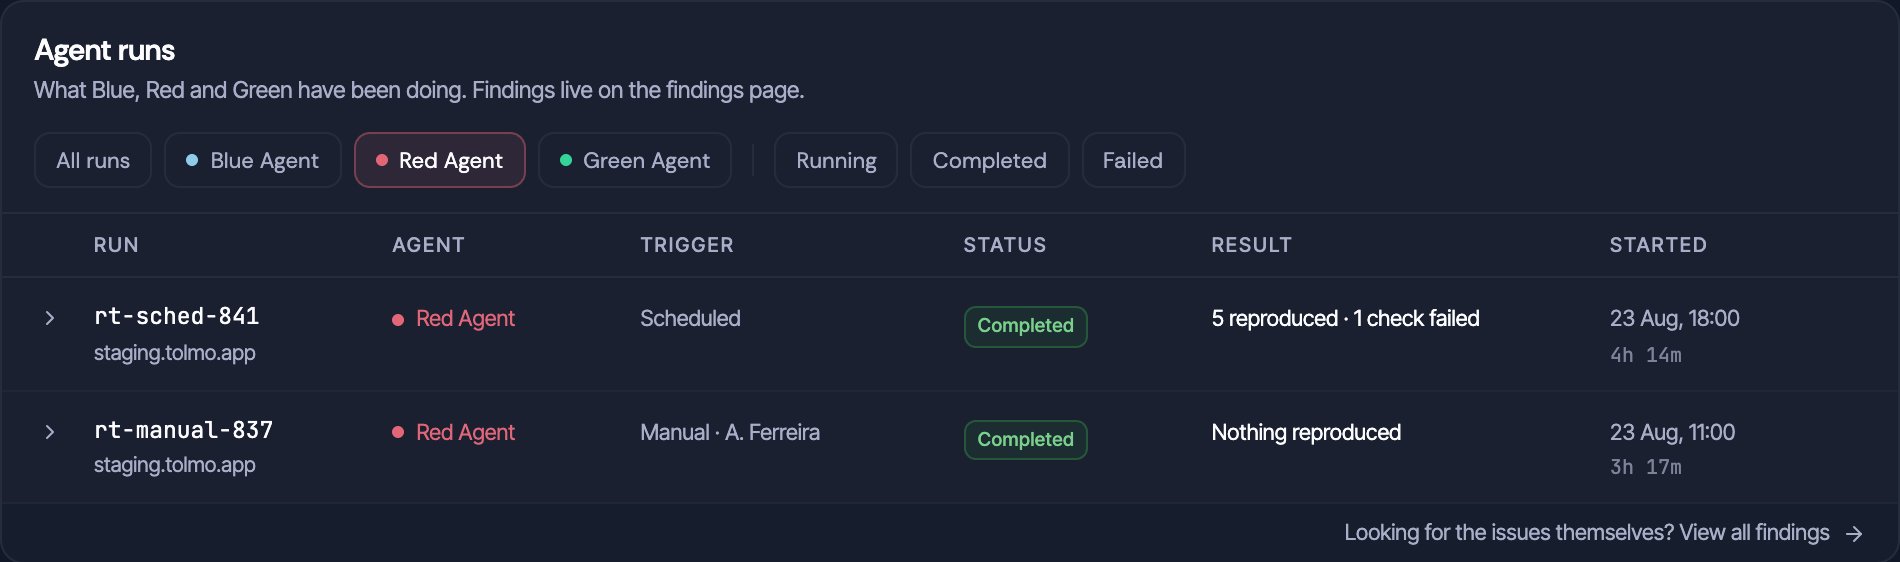
Agent runs, filtered to Red. The filter is part of the link, so you can share the filtered view.
You can filter runs by agent: Red team, Blue team, or Green team. You can also filter by status. You can also filter by findings: Has findings or No findings.
A failed check is a probe that did not complete. It shows a gap in coverage. It is not a vulnerability. The Result column shows failed checks, so you can see where coverage stopped.
Examine a run
Each run has a detail page. The page shows:- Run stages: the current stage of the run in its pipeline. This updates during the run.
- Endpoint coverage: the routes that the run tested.
- Findings: the names of the findings that the run touched.
Stop a run
You can stop a run from its detail page. Tolmo then stops the workflow of the run and deletes its sandbox. You cannot undo this. You can stop a run only while its status is Running.From the CLI
To show recent runs, use these commands:
Each JSON response contains
items and total. To get the next pages, increase --offset.
tolmo blue-agent runs also accepts two more flags:
--scope: comma-separated target hostnames.--search: a run ID or a workflow ID.
RUN- prefix, or a workflow ID. The detail view shows the execution stages of the run. A completed run does not mean that the agent confirmed a finding. Always examine the result and the linked finding.
To start or schedule Red runs from the CLI, see the red-agent command reference.