> ## Documentation Index
> Fetch the complete documentation index at: https://docs.tolmo.com/llms.txt
> Use this file to discover all available pages before exploring further.
# Red Team Agent: Automated Penetration Testing
> Red Team Agent tests your authorized domains the way an attacker would. Authorize domains, understand the ten-day run schedule, review validated findings, and copy a fix prompt straight into your editor.
 Red Team Agent tests your authorized domains the way an attacker would, and reports only what it could actually reproduce — so you can fix real vulnerabilities before somebody else finds them.
This page covers the current release: how to authorize what it may test, when it runs, how to read what it finds, and how to act on a finding without leaving the page.
## What Red Team Agent does
Red Team Agent attacks your own application from the outside, the way an attacker with no inside knowledge would. It works only against domains your organization has explicitly authorized, it announces itself as a test, and it never sends anything destructive.
It reports what it could actually reproduce. A finding appears because the agent ran a request and got a result it should not have — not because a scanner recognized a pattern. Every finding carries the request that proved it.
### The lifecycle
Four steps, and the product is arranged in that order:
You authorize what may be tested, once.
Testing happens on a schedule, without being asked.
What the agent proves arrives on the Red Team Agent page.
Each finding carries enough context to be fixed from the page it is on.
Red Team Agent tests your authorized domains the way an attacker would, and reports only what it could actually reproduce — so you can fix real vulnerabilities before somebody else finds them.
This page covers the current release: how to authorize what it may test, when it runs, how to read what it finds, and how to act on a finding without leaving the page.
## What Red Team Agent does
Red Team Agent attacks your own application from the outside, the way an attacker with no inside knowledge would. It works only against domains your organization has explicitly authorized, it announces itself as a test, and it never sends anything destructive.
It reports what it could actually reproduce. A finding appears because the agent ran a request and got a result it should not have — not because a scanner recognized a pattern. Every finding carries the request that proved it.
### The lifecycle
Four steps, and the product is arranged in that order:
You authorize what may be tested, once.
Testing happens on a schedule, without being asked.
What the agent proves arrives on the Red Team Agent page.
Each finding carries enough context to be fixed from the page it is on.
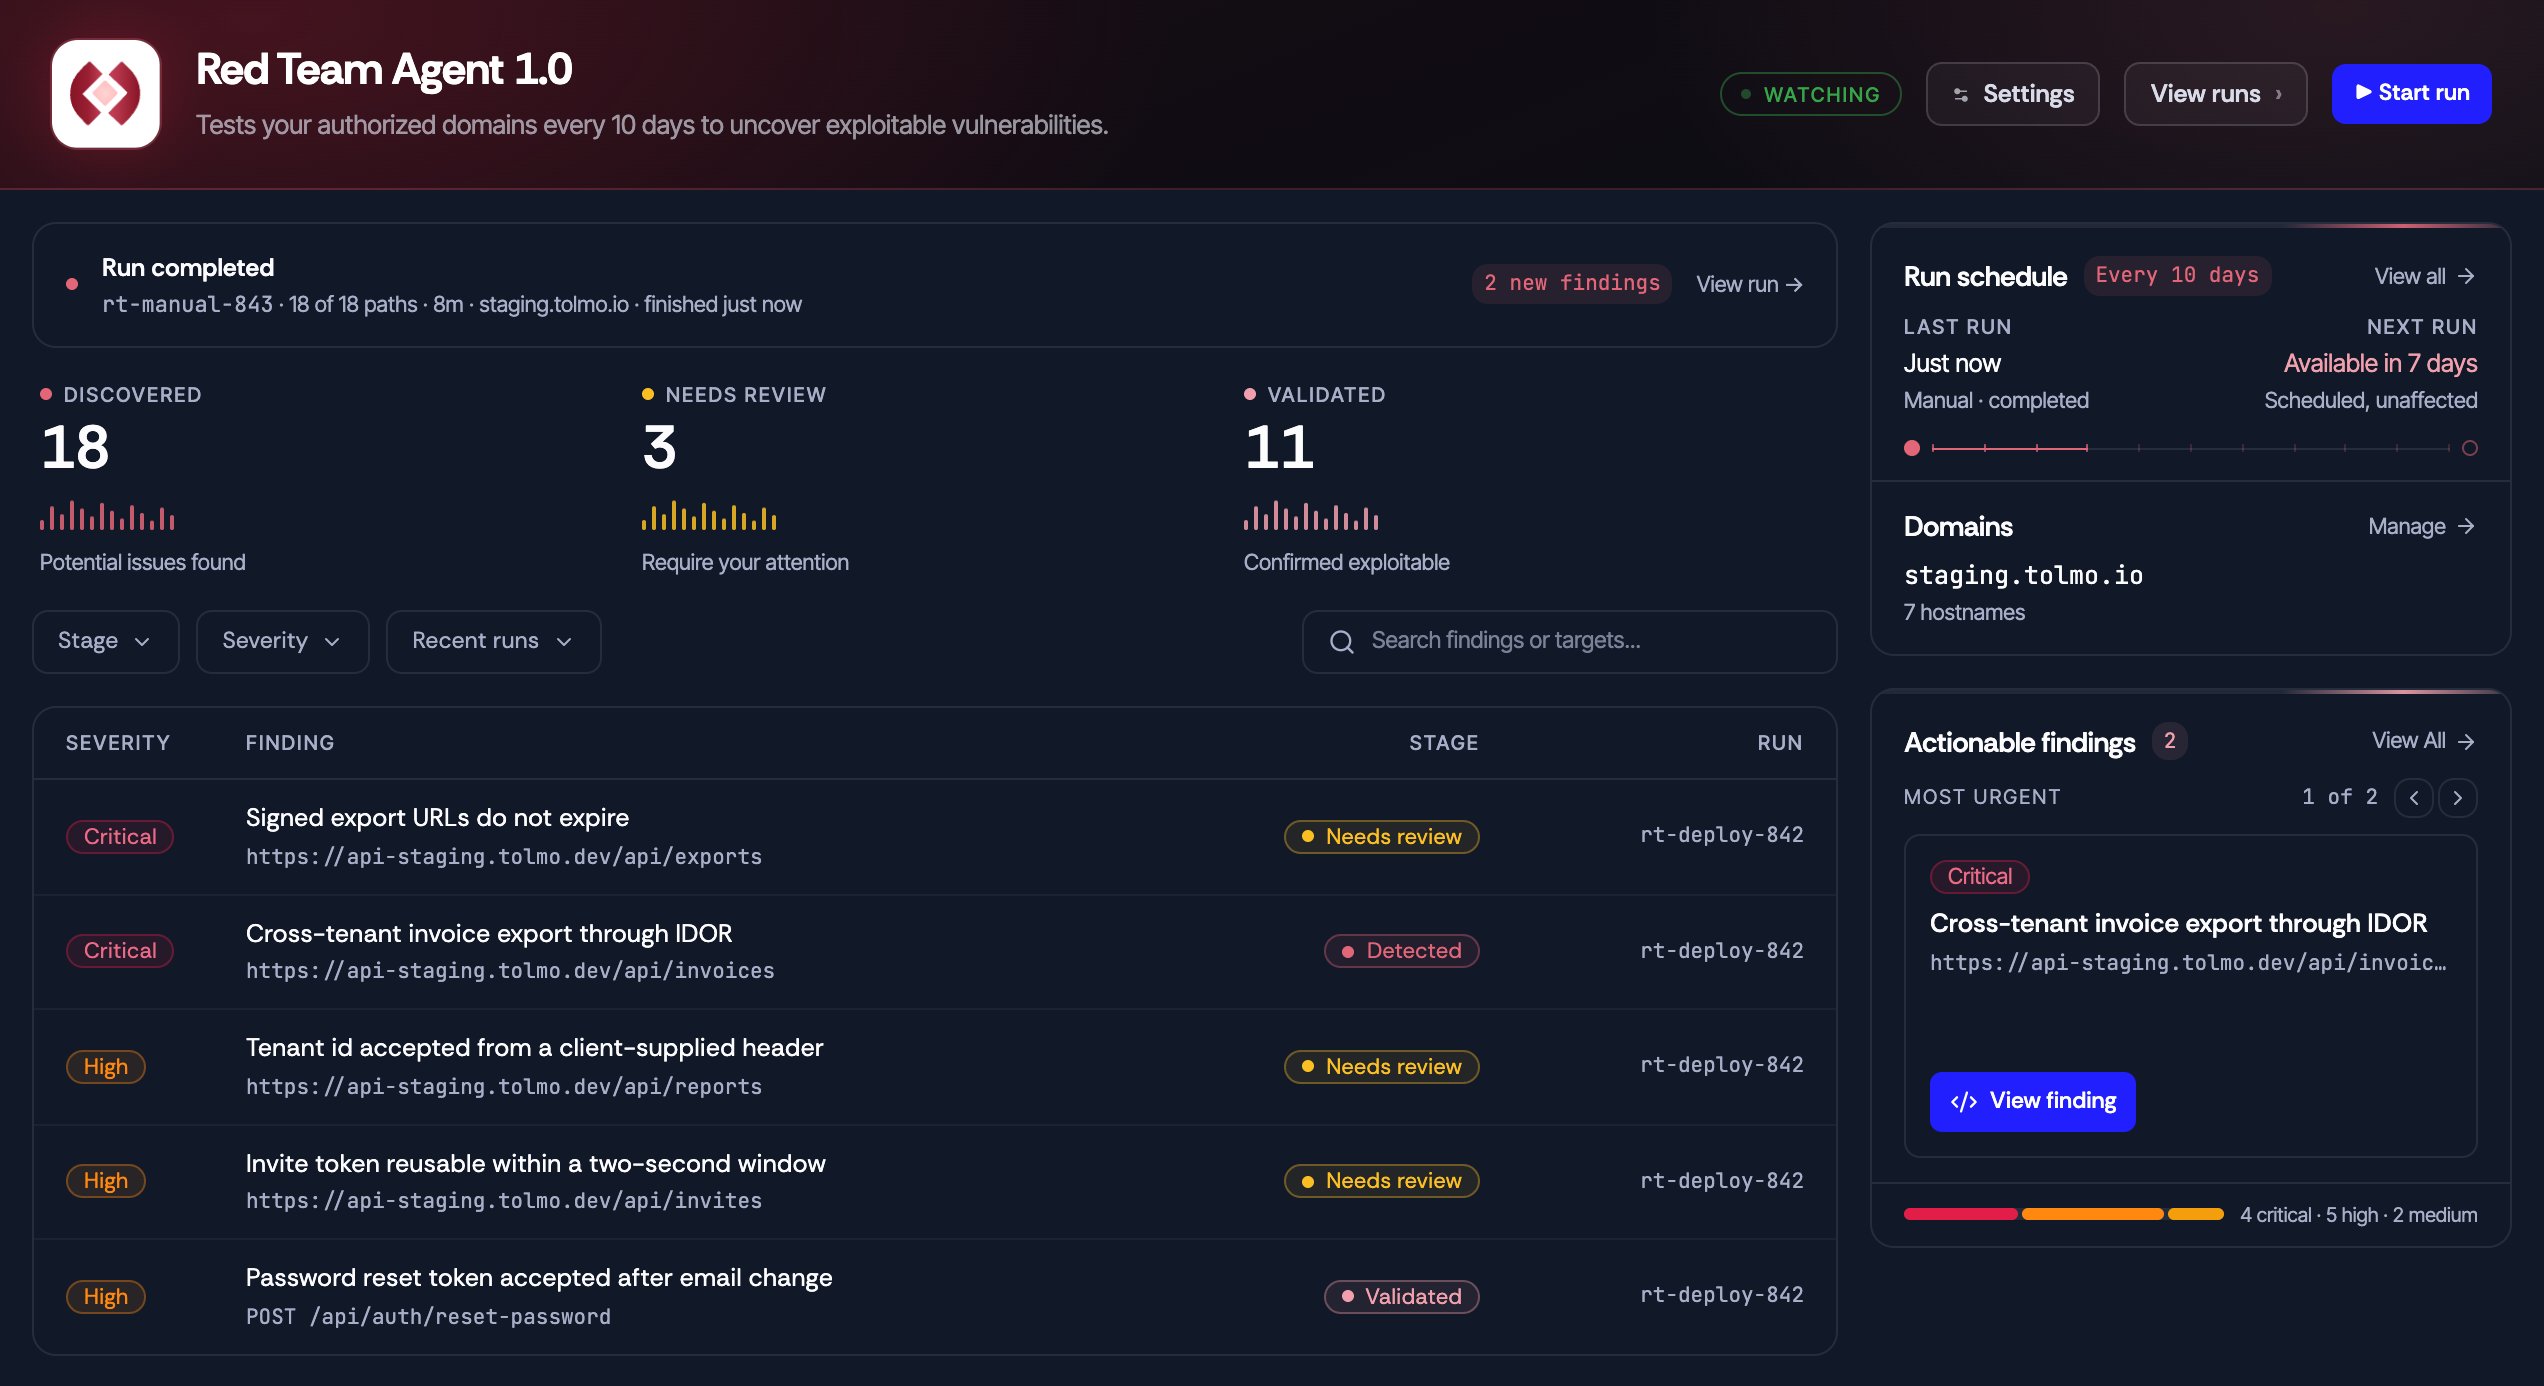 Red Team Agent is one of three agents that share a findings model. Blue triages findings from your other security tools, and Green verifies fixes. Red is the one that goes and attacks something.
## Set up Red Team Agent
Until something is in scope there is nothing to attack, so a new workspace opens on a setup checklist instead of an empty dashboard. Three tasks, each with the control that completes it.
Red Team Agent is one of three agents that share a findings model. Blue triages findings from your other security tools, and Green verifies fixes. Red is the one that goes and attacks something.
## Set up Red Team Agent
Until something is in scope there is nothing to attack, so a new workspace opens on a setup checklist instead of an empty dashboard. Three tasks, each with the control that completes it.
 | Task | What it gets you |
| -------------------------------- | -------------------------------------------------------------------------------------------------------------------------------------------------------------------- |
| **Connect your environment** | AWS, GCP, or Azure. Your attack surface is discovered from the connected account rather than typed in by hand, so this is what gives the agent something to look at. |
| **Configure authorized domains** | The domains the agent is permitted to test. Nothing outside this list is ever in scope. |
| **Configure notifications** | Where run results and new findings are announced. |
Once a domain is authorized, the header status changes from **Not set up** to **Watching** and the agent joins the schedule. Everything after this point is adjustment, not setup.
### Change the configuration later
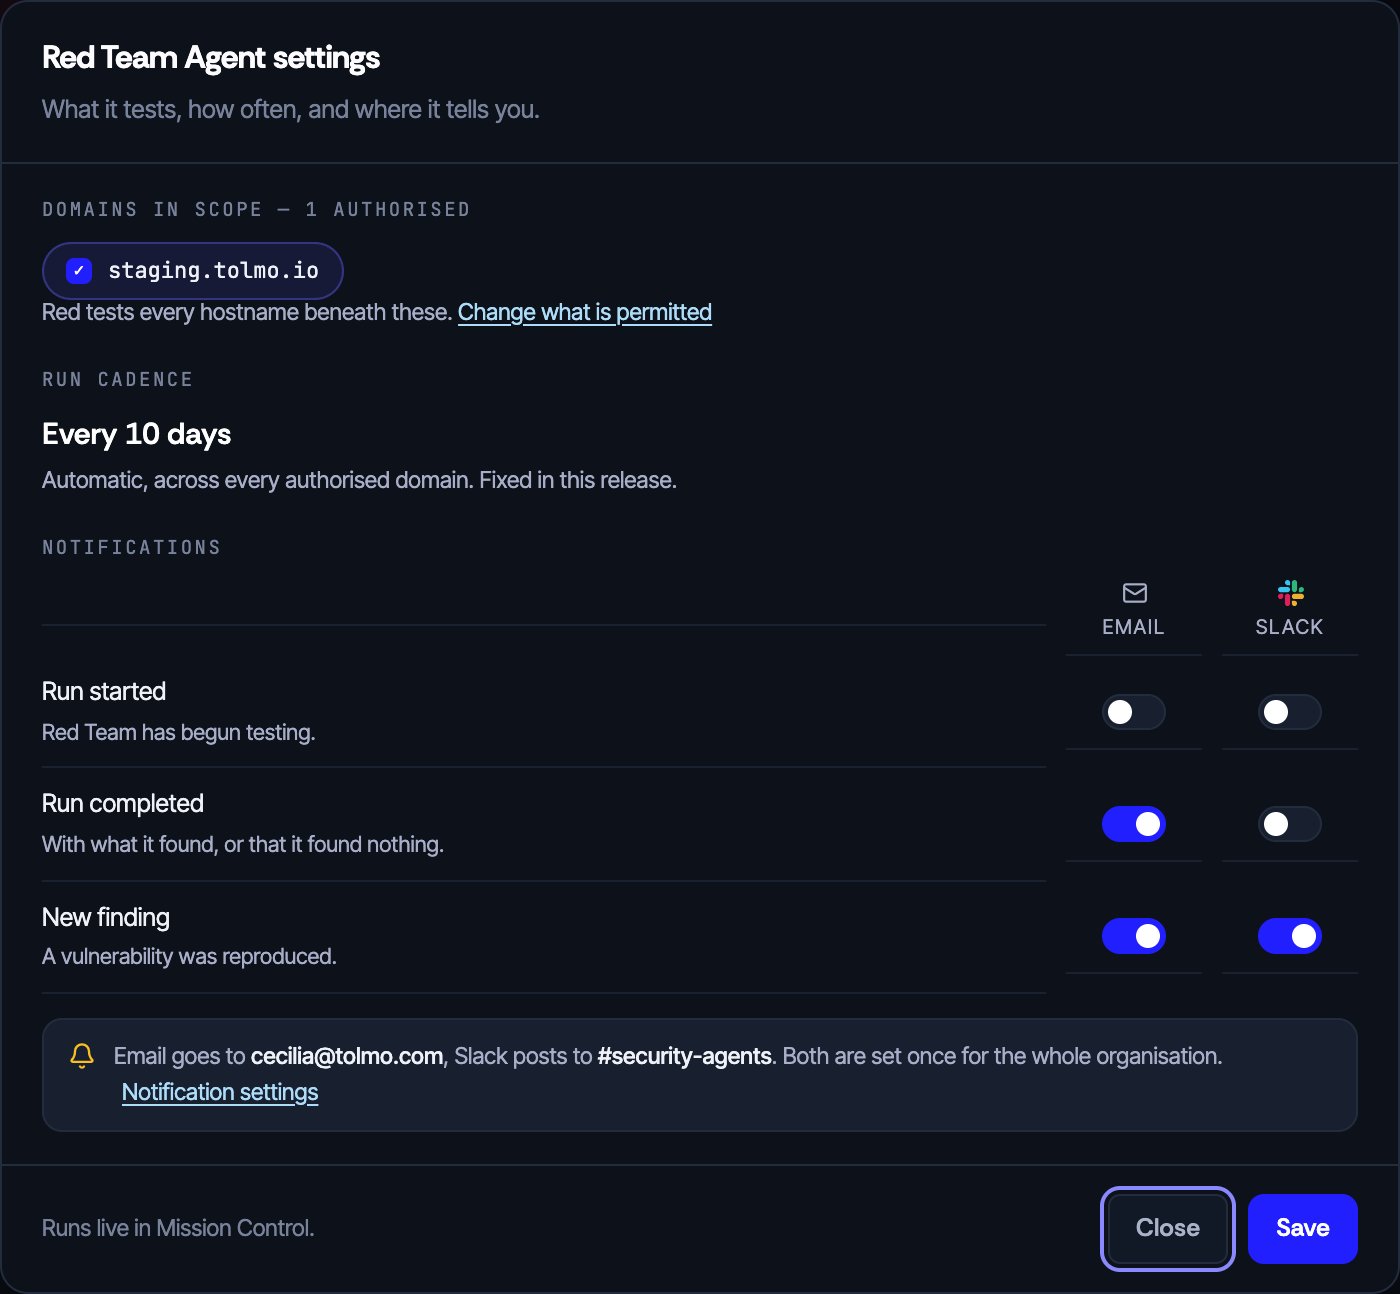
Open **Settings** in the page header. One dialog holds what the agent tests, how often it tests, and where it reports — the three things you might come back to change.
| Task | What it gets you |
| -------------------------------- | -------------------------------------------------------------------------------------------------------------------------------------------------------------------- |
| **Connect your environment** | AWS, GCP, or Azure. Your attack surface is discovered from the connected account rather than typed in by hand, so this is what gives the agent something to look at. |
| **Configure authorized domains** | The domains the agent is permitted to test. Nothing outside this list is ever in scope. |
| **Configure notifications** | Where run results and new findings are announced. |
Once a domain is authorized, the header status changes from **Not set up** to **Watching** and the agent joins the schedule. Everything after this point is adjustment, not setup.
### Change the configuration later
Open **Settings** in the page header. One dialog holds what the agent tests, how often it tests, and where it reports — the three things you might come back to change.
 ## Authorize the domains it may test
**Domains in scope** is the list of domains Red Team Agent is allowed to attack. It is the only thing that decides where the agent may act: a hostname that is not covered by an entry on this list is never touched, on any run.
### Why authorization is required
Your domain inventory is built from public DNS and certificate transparency, so it lists names your organization does not own — a typosquat, a partner's hostname, something a former employee still holds. Appearing in the inventory is not ownership, and it is not permission to attack. Authorization is therefore two separate steps, in this order:
Tolmo gives you a `tolmo-domain-verification=…` TXT record to publish in the domain's DNS zone. Only someone who controls the zone can publish it, which is the point — it cannot simply be asserted.
A separate, explicit decision that offensive testing is allowed against it. Verifying a domain does not authorize anything on its own.
## Authorize the domains it may test
**Domains in scope** is the list of domains Red Team Agent is allowed to attack. It is the only thing that decides where the agent may act: a hostname that is not covered by an entry on this list is never touched, on any run.
### Why authorization is required
Your domain inventory is built from public DNS and certificate transparency, so it lists names your organization does not own — a typosquat, a partner's hostname, something a former employee still holds. Appearing in the inventory is not ownership, and it is not permission to attack. Authorization is therefore two separate steps, in this order:
Tolmo gives you a `tolmo-domain-verification=…` TXT record to publish in the domain's DNS zone. Only someone who controls the zone can publish it, which is the point — it cannot simply be asserted.
A separate, explicit decision that offensive testing is allowed against it. Verifying a domain does not authorize anything on its own.
 ### What an entry covers
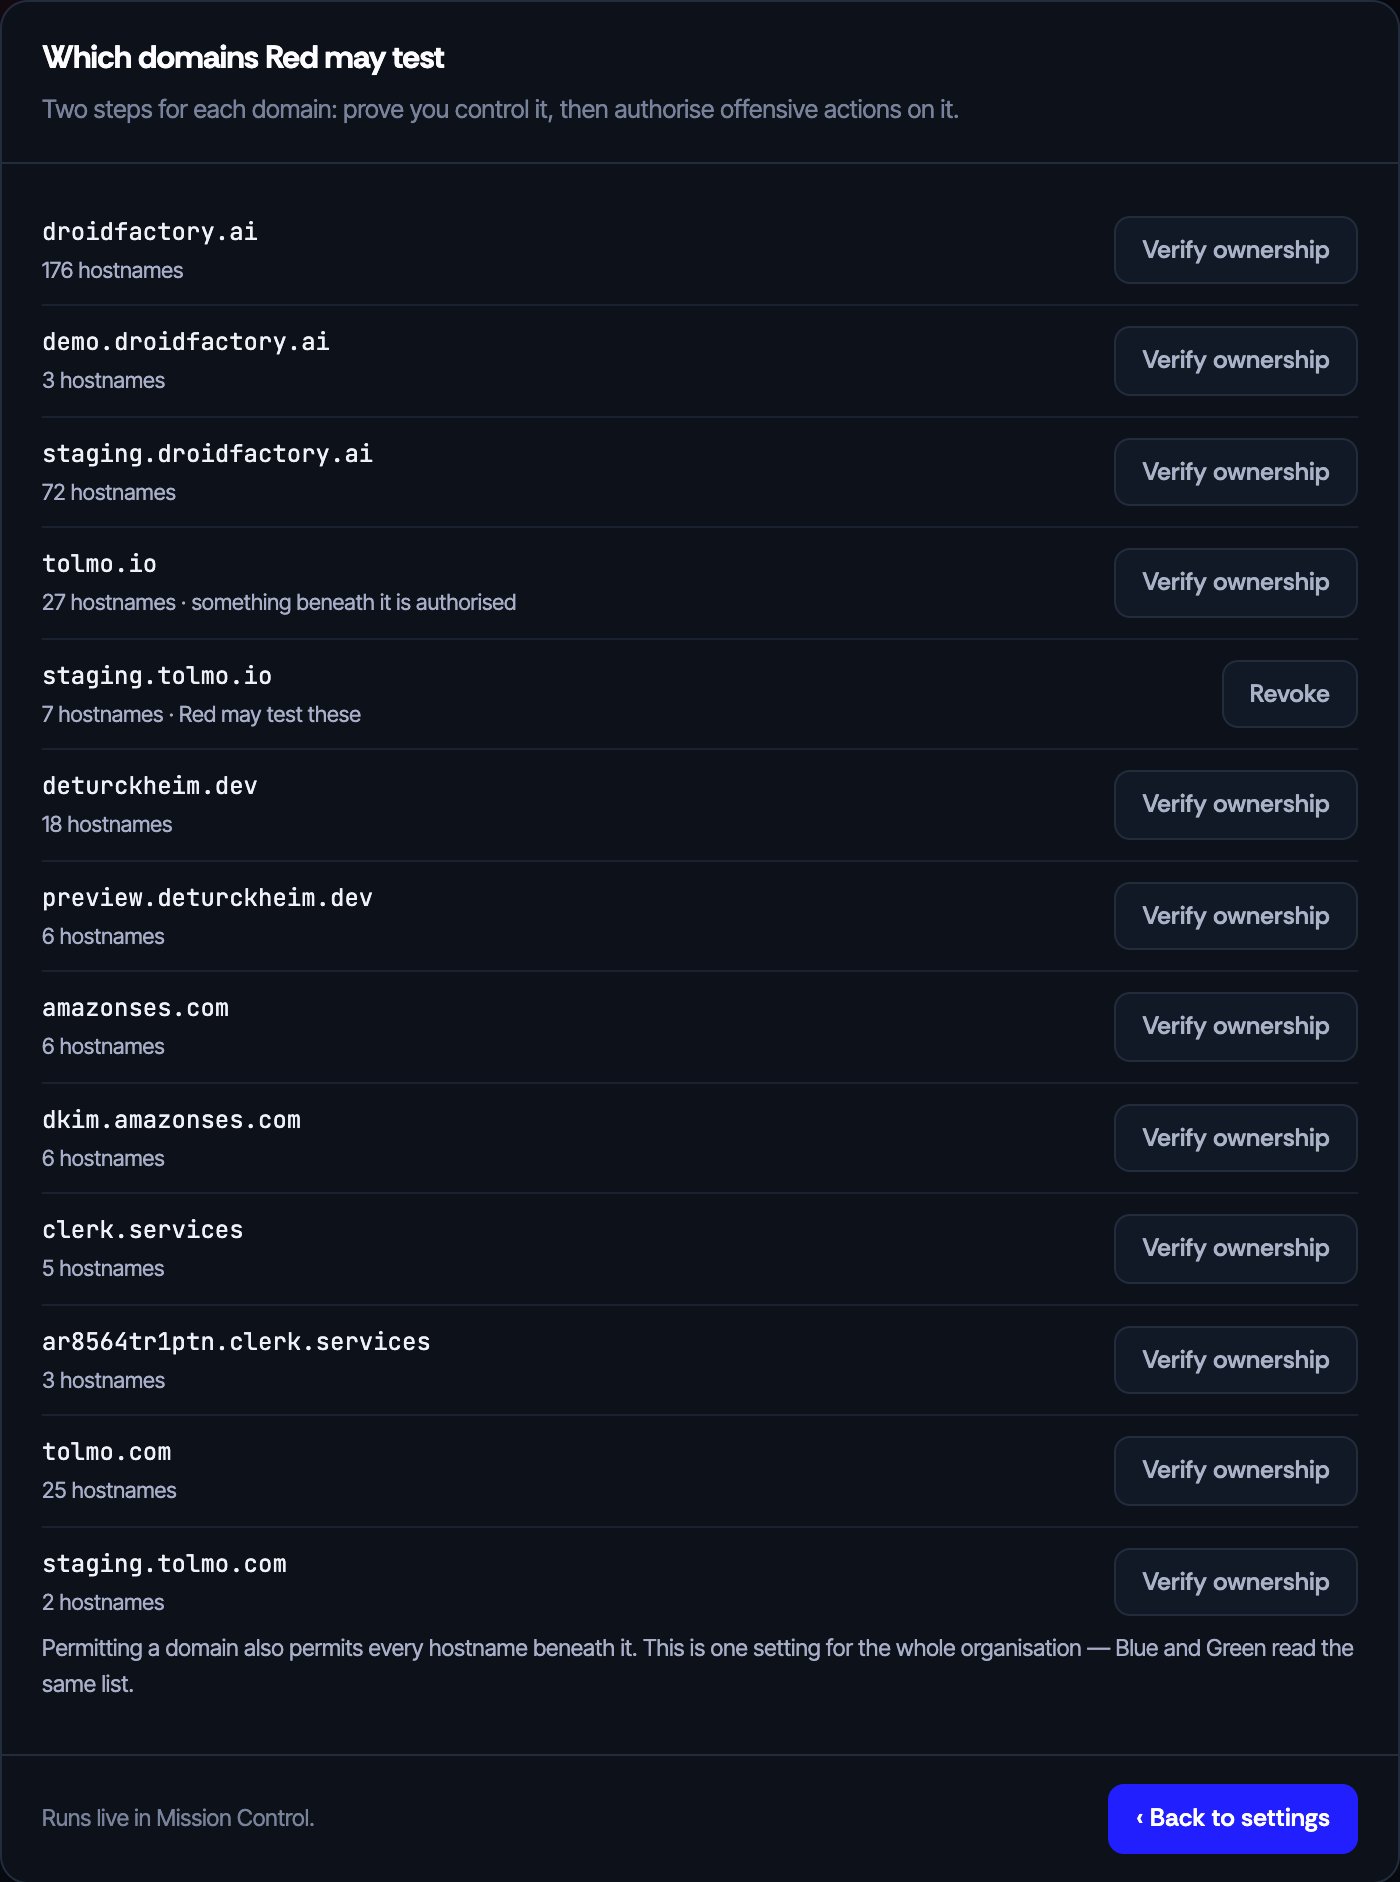
An entry covers the domain and everything beneath it. Permitting `staging.example.com` permits every hostname under it, which is how people already think about a staging environment. The row shows the hostname count so you can see the size of what you are agreeing to.
Each domain in the list reads as one of three states:
* **Red may test these** — verified and permitted. In scope.
* **Ownership proven, not authorised** — verified, but deliberately not permitted.
* **Something beneath it is authorised** — the domain itself is out of scope, but an entry below it is in scope.
This is one setting for the whole organization, not a per-agent one. Blue and Green read the same list. Revoking an entry takes effect immediately: the agents read the list at the moment they run, so the next run is already out of scope. Revoking keeps the ownership verification, so you never have to re-publish a DNS record to undo a policy decision.
### Where to manage it
Two routes to the same list. Use **Change what is permitted** inside **Settings** when you are already adjusting the agent, or **Manage** on the **Domains** card to open the domain inventory, where the permission lives as a property of the domain.
## Understand the run schedule
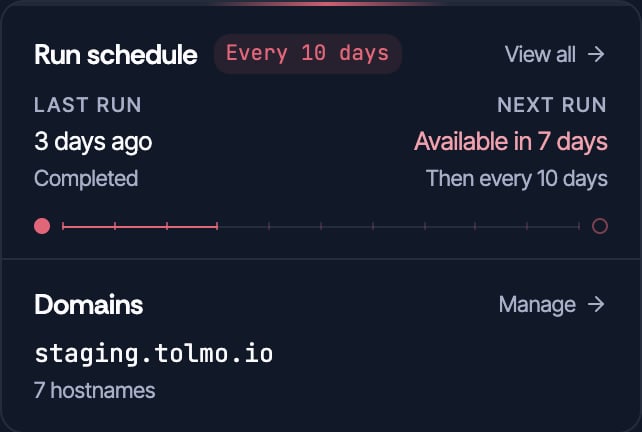
Red Team Agent tests every **10 days**, automatically, across every authorized domain. A full run takes roughly ninety minutes, and its findings take days to work through — ten days leaves room to close them before the next run asks again.
The cadence is fixed in this release. It is stated on the **Run schedule** card and in **Settings** as a fact rather than offered as a choice, because there is no control that changes it.
### What an entry covers
An entry covers the domain and everything beneath it. Permitting `staging.example.com` permits every hostname under it, which is how people already think about a staging environment. The row shows the hostname count so you can see the size of what you are agreeing to.
Each domain in the list reads as one of three states:
* **Red may test these** — verified and permitted. In scope.
* **Ownership proven, not authorised** — verified, but deliberately not permitted.
* **Something beneath it is authorised** — the domain itself is out of scope, but an entry below it is in scope.
This is one setting for the whole organization, not a per-agent one. Blue and Green read the same list. Revoking an entry takes effect immediately: the agents read the list at the moment they run, so the next run is already out of scope. Revoking keeps the ownership verification, so you never have to re-publish a DNS record to undo a policy decision.
### Where to manage it
Two routes to the same list. Use **Change what is permitted** inside **Settings** when you are already adjusting the agent, or **Manage** on the **Domains** card to open the domain inventory, where the permission lives as a property of the domain.
## Understand the run schedule
Red Team Agent tests every **10 days**, automatically, across every authorized domain. A full run takes roughly ninety minutes, and its findings take days to work through — ten days leaves room to close them before the next run asks again.
The cadence is fixed in this release. It is stated on the **Run schedule** card and in **Settings** as a fact rather than offered as a choice, because there is no control that changes it.
 | Field | What it tells you |
| ----------------- | ------------------------------------------------------------------------------------------------------------------------------------------------------------------- |
| **Last run** | When the most recent run happened and how it ended. **Completed** means the run finished; what it concluded is the three numbers and the findings table below. |
| **Next run** | When the agent will test again on its own — **Available today**, **Available tomorrow**, or **Available in n days**. |
| **Every 10 days** | The cadence, as a tag beside the card title. The rail underneath has one tick per day, so the gap reads as a countable stretch rather than an undifferentiated bar. |
| **Domains** | What the schedule runs against, in the same card. A schedule with no scope is a rhythm against nothing, so the two are one answer. |
**Start run** in the page header runs the agent now, against the same authorized domains. It is an additional run: it does not consume the scheduled one and it does not move the date on the right. If ten days is too slow for your release cycle, the run dialog carries a way to ask us for a faster schedule.
**View all** on the card, and **View runs** in the header, both open the full run history. See [View run history in Mission Control](#view-run-history-in-mission-control).
## Choose where results are announced
Runs happen without you watching, so notifications are how you find out. Open **Settings** in the page header and use the **Notifications** grid: events down the side, channels across the top. One cell answers "does a completed run reach Slack".
| Field | What it tells you |
| ----------------- | ------------------------------------------------------------------------------------------------------------------------------------------------------------------- |
| **Last run** | When the most recent run happened and how it ended. **Completed** means the run finished; what it concluded is the three numbers and the findings table below. |
| **Next run** | When the agent will test again on its own — **Available today**, **Available tomorrow**, or **Available in n days**. |
| **Every 10 days** | The cadence, as a tag beside the card title. The rail underneath has one tick per day, so the gap reads as a countable stretch rather than an undifferentiated bar. |
| **Domains** | What the schedule runs against, in the same card. A schedule with no scope is a rhythm against nothing, so the two are one answer. |
**Start run** in the page header runs the agent now, against the same authorized domains. It is an additional run: it does not consume the scheduled one and it does not move the date on the right. If ten days is too slow for your release cycle, the run dialog carries a way to ask us for a faster schedule.
**View all** on the card, and **View runs** in the header, both open the full run history. See [View run history in Mission Control](#view-run-history-in-mission-control).
## Choose where results are announced
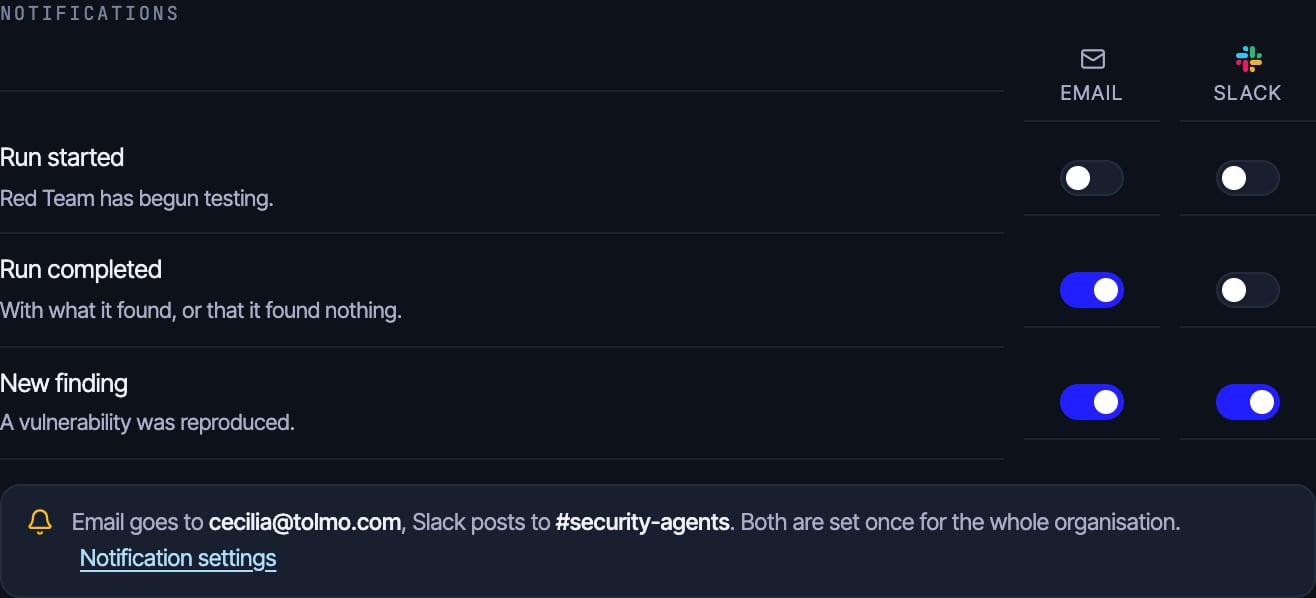
Runs happen without you watching, so notifications are how you find out. Open **Settings** in the page header and use the **Notifications** grid: events down the side, channels across the top. One cell answers "does a completed run reach Slack".
 | Event | When it fires |
| ----------------- | --------------------------------------------- |
| **Run started** | Red Team Agent has begun testing. |
| **Run completed** | With what it found, or that it found nothing. |
| **New finding** | A vulnerability was reproduced. |
Channels are **Email** and **Slack**. The destinations — which address, which channel — are set once for the whole organization in **Notification settings**, not per agent. The panel names the current destinations so you can see where a toggle will actually send something.
A run that finds nothing still sends a **Run completed** notification if that event is on. A clean result is a result, and silence is indistinguishable from a run that never started.
## Understand your results
Three numbers sit above the findings table. They describe the same set of issues at three different levels of certainty, so reading them left to right tells you how much of the last run is settled.
| Event | When it fires |
| ----------------- | --------------------------------------------- |
| **Run started** | Red Team Agent has begun testing. |
| **Run completed** | With what it found, or that it found nothing. |
| **New finding** | A vulnerability was reproduced. |
Channels are **Email** and **Slack**. The destinations — which address, which channel — are set once for the whole organization in **Notification settings**, not per agent. The panel names the current destinations so you can see where a toggle will actually send something.
A run that finds nothing still sends a **Run completed** notification if that event is on. A clean result is a result, and silence is indistinguishable from a run that never started.
## Understand your results
Three numbers sit above the findings table. They describe the same set of issues at three different levels of certainty, so reading them left to right tells you how much of the last run is settled.
 | Metric | What it counts |
| ---------------- | ---------------------------------------------------------------------------------------------------------------------------------------------------------------------------------- |
| **Discovered** | Potential issues found. Everything the run surfaced, before the agent decided what it could prove. |
| **Needs review** | Require your attention. The agent got far enough to be worth your time and not far enough to call it, so it is holding the finding for a person. This is the number you work down. |
| **Validated** | Confirmed exploitable. The agent reproduced the issue and kept the request that did it. |
After a run that found nothing, all three read zero and the table says so explicitly rather than looking empty. A run that completed clean is the product working.
| Metric | What it counts |
| ---------------- | ---------------------------------------------------------------------------------------------------------------------------------------------------------------------------------- |
| **Discovered** | Potential issues found. Everything the run surfaced, before the agent decided what it could prove. |
| **Needs review** | Require your attention. The agent got far enough to be worth your time and not far enough to call it, so it is holding the finding for a person. This is the number you work down. |
| **Validated** | Confirmed exploitable. The agent reproduced the issue and kept the request that did it. |
After a run that found nothing, all three read zero and the table says so explicitly rather than looking empty. A run that completed clean is the product working.
 ## Review findings
The findings table lists what the last runs produced, most severe first. Four columns: **Severity**, **Finding**, **Stage**, and **Run**.
## Review findings
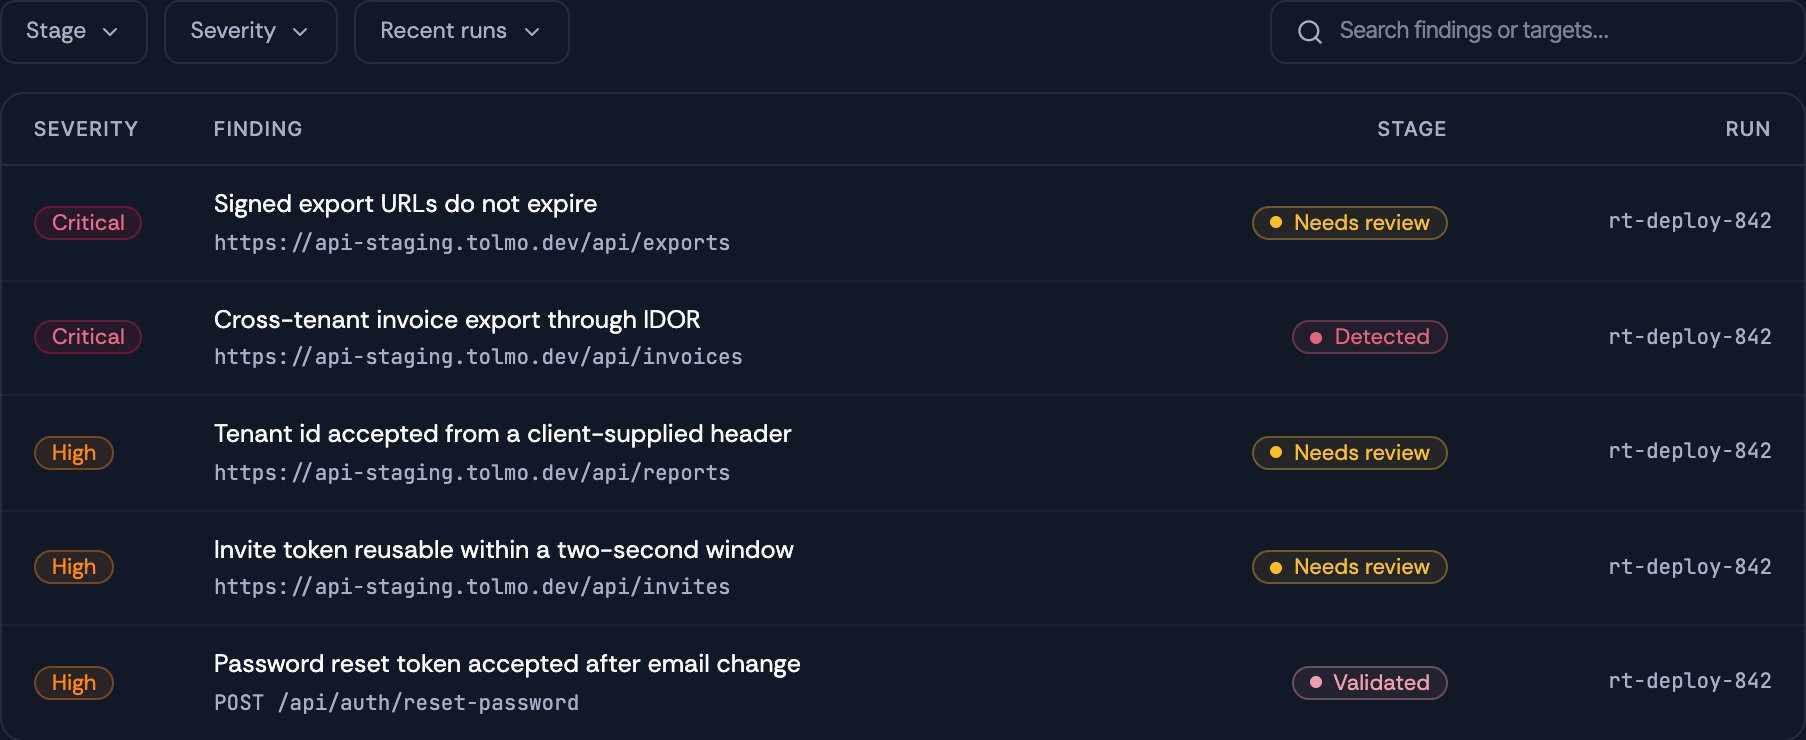
The findings table lists what the last runs produced, most severe first. Four columns: **Severity**, **Finding**, **Stage**, and **Run**.
 ### Narrow the list
* **Search findings or targets** matches both the finding title and the affected address, so you can search by endpoint as well as by name.
* **Stage**, **Severity**, and **Recent runs** filter the list. Each choice you make becomes a tag underneath that you can drop on its own.
### Severity
**Critical**, **High**, **Medium**, and **Low**, on the same scale and in the same colors as the rest of Tolmo. It is the first column and the table sorts by it, so the row at the top is the one to open.
### Stage
The stage says where a finding is in its life on this page.
| Stage | Meaning |
| ------------------------------------------- | ------------------------------------------------------------------------------------------------------------------------------------------------------------------------ |
| **Detected** | Reproduced by the agent and not waiting on anybody. Ready to be fixed. |
| **Validated** | Confirmed exploitable, with the request that did it kept as evidence. |
| **Needs review** | Waiting on your decision. Open the row and answer it there. |
| **Accepted** · **Dismissed** · **Deferred** | What a **Needs review** finding becomes once you have answered it. A dismissed finding keeps the reason it was dismissed, and does not come back as new on the next run. |
### The affected target
Under each title is the address or endpoint the finding is about — a full URL, or a method and path such as `POST /api/auth/reset-password`. The **Run** column names the run that produced it, which is the link back into the run history.
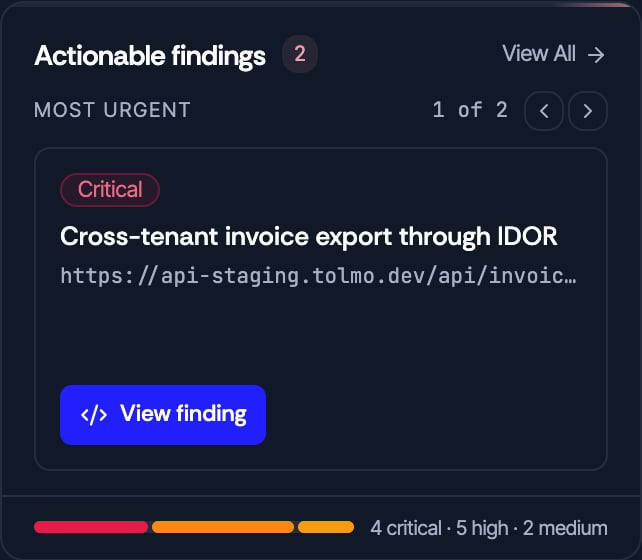
The table on this page is a working view of the most urgent findings, not the whole record. **Open in Findings** inside any finding, and **View All** on the **Actionable findings** card, open the full findings list with the same context carried over.
### Narrow the list
* **Search findings or targets** matches both the finding title and the affected address, so you can search by endpoint as well as by name.
* **Stage**, **Severity**, and **Recent runs** filter the list. Each choice you make becomes a tag underneath that you can drop on its own.
### Severity
**Critical**, **High**, **Medium**, and **Low**, on the same scale and in the same colors as the rest of Tolmo. It is the first column and the table sorts by it, so the row at the top is the one to open.
### Stage
The stage says where a finding is in its life on this page.
| Stage | Meaning |
| ------------------------------------------- | ------------------------------------------------------------------------------------------------------------------------------------------------------------------------ |
| **Detected** | Reproduced by the agent and not waiting on anybody. Ready to be fixed. |
| **Validated** | Confirmed exploitable, with the request that did it kept as evidence. |
| **Needs review** | Waiting on your decision. Open the row and answer it there. |
| **Accepted** · **Dismissed** · **Deferred** | What a **Needs review** finding becomes once you have answered it. A dismissed finding keeps the reason it was dismissed, and does not come back as new on the next run. |
### The affected target
Under each title is the address or endpoint the finding is about — a full URL, or a method and path such as `POST /api/auth/reset-password`. The **Run** column names the run that produced it, which is the link back into the run history.
The table on this page is a working view of the most urgent findings, not the whole record. **Open in Findings** inside any finding, and **View All** on the **Actionable findings** card, open the full findings list with the same context carried over.
 ## Take action on a finding
Click a row. The finding opens in place, underneath the row it belongs to — the table stays where it is, so closing it puts you back exactly where you were.
It opens on one layer, which answers four questions in order:
* **What happened** — what the agent did, and what came back.
* **Why it matters** — who could do this, and what they would get.
* **Key evidence** — the one request and response that carries the argument.
* **Recommended fix** — the change that closes it.
## Take action on a finding
Click a row. The finding opens in place, underneath the row it belongs to — the table stays where it is, so closing it puts you back exactly where you were.
It opens on one layer, which answers four questions in order:
* **What happened** — what the agent did, and what came back.
* **Why it matters** — who could do this, and what they would get.
* **Key evidence** — the one request and response that carries the argument.
* **Recommended fix** — the change that closes it.
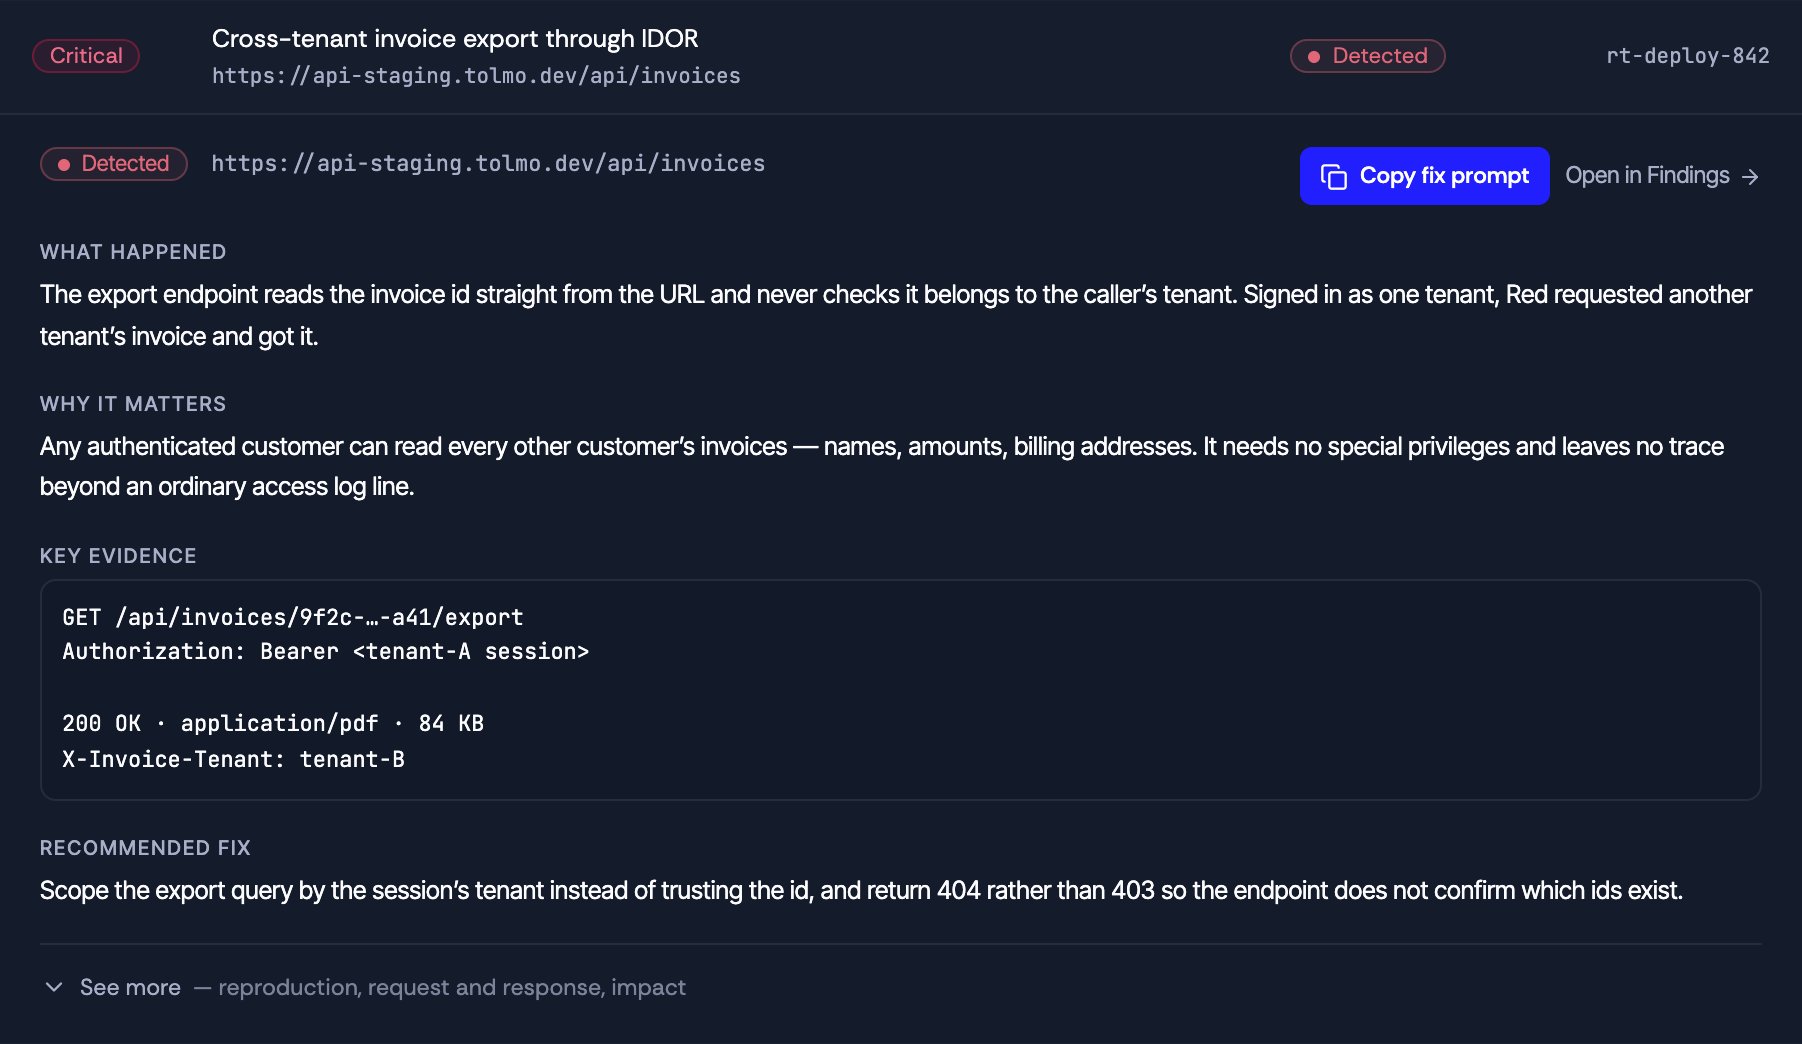 This is enough to decide and act on without reading a technical report. The technical record is kept, folded behind [See more](#see-the-complete-technical-detail).
### Answer a finding that needs review
A **Needs review** finding carries three answers in its own panel. There is no fourth.
This is enough to decide and act on without reading a technical report. The technical record is kept, folded behind [See more](#see-the-complete-technical-detail).
### Answer a finding that needs review
A **Needs review** finding carries three answers in its own panel. There is no fourth.
 | Answer | What it means |
| ----------- | --------------------------------------------------------------------------------------------------------------------------------------------------------------------------------------------------------------------------------------- |
| **Accept** | It is real. The finding moves on as something to fix. |
| **Dismiss** | It is not. Choose a reason — **Not exploitable**, **Accepted risk**, **False positive**, **Out of scope**, or **Already fixed**. The reason is kept with the decision, so the next person can see why rather than doing the work again. |
| **Defer** | Not now. It stays in the queue. |
A decision stays decided. What you dismiss does not return as a new finding on the next run, and **Undo** is there beside the decision if you clicked the wrong one.
## Copy a fix prompt
**Copy fix prompt** is the primary action on every finding. It copies the whole finding to your clipboard as a single instruction, written for a coding agent, scoped to the affected endpoint.
| Answer | What it means |
| ----------- | --------------------------------------------------------------------------------------------------------------------------------------------------------------------------------------------------------------------------------------- |
| **Accept** | It is real. The finding moves on as something to fix. |
| **Dismiss** | It is not. Choose a reason — **Not exploitable**, **Accepted risk**, **False positive**, **Out of scope**, or **Already fixed**. The reason is kept with the decision, so the next person can see why rather than doing the work again. |
| **Defer** | Not now. It stays in the queue. |
A decision stays decided. What you dismiss does not return as a new finding on the next run, and **Undo** is there beside the decision if you clicked the wrong one.
## Copy a fix prompt
**Copy fix prompt** is the primary action on every finding. It copies the whole finding to your clipboard as a single instruction, written for a coding agent, scoped to the affected endpoint.
 What you get is the finding as a prompt: the severity and title, the affected address, what happened, why it matters, the evidence, and the recommended fix — ending with an instruction to propose the smallest change that closes it and to say how to verify the fix.
Paste it into whatever you fix code with — Claude Code, your editor's assistant, or a colleague's terminal. Tolmo does not apply the change: the agent identifies and proves the vulnerability, Tolmo hands over the context to fix it, and you decide what to ship.
The prompt is deliberately self-contained. It carries the evidence, so whoever receives it does not need access to Tolmo to understand what they are fixing.
## See the complete technical detail
**See more**, at the bottom of an open finding, unfolds the technical record. The first layer is for deciding and acting; this layer is for whoever has to reproduce the issue or review the fix.
What you get is the finding as a prompt: the severity and title, the affected address, what happened, why it matters, the evidence, and the recommended fix — ending with an instruction to propose the smallest change that closes it and to say how to verify the fix.
Paste it into whatever you fix code with — Claude Code, your editor's assistant, or a colleague's terminal. Tolmo does not apply the change: the agent identifies and proves the vulnerability, Tolmo hands over the context to fix it, and you decide what to ship.
The prompt is deliberately self-contained. It carries the evidence, so whoever receives it does not need access to Tolmo to understand what they are fixing.
## See the complete technical detail
**See more**, at the bottom of an open finding, unfolds the technical record. The first layer is for deciding and acting; this layer is for whoever has to reproduce the issue or review the fix.
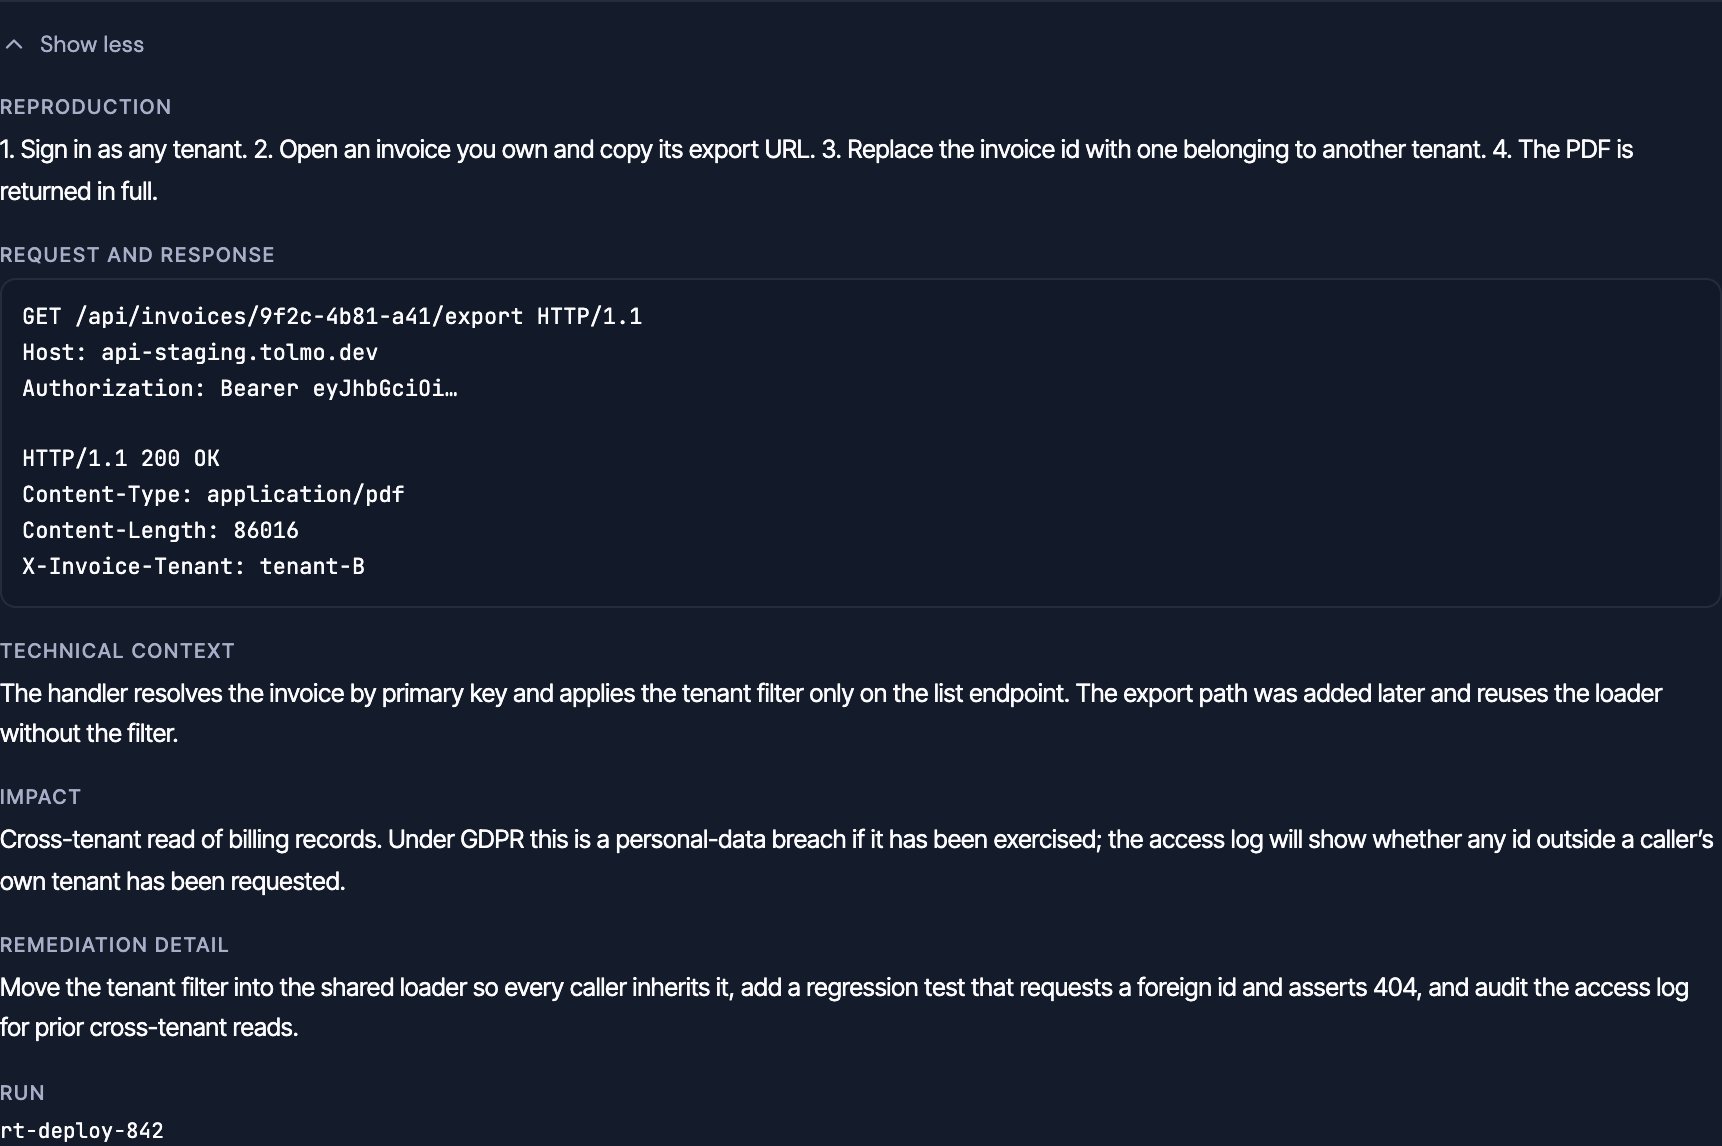 | Section | What it holds |
| ------------------------ | -------------------------------------------------------------------------------------- |
| **Reproduction** | Numbered steps that reproduce the issue from a signed-in session. |
| **Request and response** | The full exchange, headers included, as the agent sent and received it. |
| **Technical context** | Why the code behaves this way — which is usually why the issue was not obvious. |
| **Impact** | What it means beyond the endpoint, including regulatory consequences where they apply. |
| **Remediation detail** | The fix in full, with the regression test and the audit worth doing alongside it. |
The hierarchy is deliberate: quick view to understand and act, **See more** to investigate. **Show less** folds it back. Not every finding has a second layer — where there is nothing more to show, the control is not there.
## View run history in Mission Control
The Red Team Agent page shows the current state: the last run, and what it left you to work on. The full operational history lives in Mission Control, which answers a different question — not "what security issues do I have" but "what have my agents been doing".
**View runs** in the page header and **View all** on the **Run schedule** card both open Mission Control with **Red Agent** already applied as a filter, so you land on your runs rather than on every run in the organization.
| Section | What it holds |
| ------------------------ | -------------------------------------------------------------------------------------- |
| **Reproduction** | Numbered steps that reproduce the issue from a signed-in session. |
| **Request and response** | The full exchange, headers included, as the agent sent and received it. |
| **Technical context** | Why the code behaves this way — which is usually why the issue was not obvious. |
| **Impact** | What it means beyond the endpoint, including regulatory consequences where they apply. |
| **Remediation detail** | The fix in full, with the regression test and the audit worth doing alongside it. |
The hierarchy is deliberate: quick view to understand and act, **See more** to investigate. **Show less** folds it back. Not every finding has a second layer — where there is nothing more to show, the control is not there.
## View run history in Mission Control
The Red Team Agent page shows the current state: the last run, and what it left you to work on. The full operational history lives in Mission Control, which answers a different question — not "what security issues do I have" but "what have my agents been doing".
**View runs** in the page header and **View all** on the **Run schedule** card both open Mission Control with **Red Agent** already applied as a filter, so you land on your runs rather than on every run in the organization.
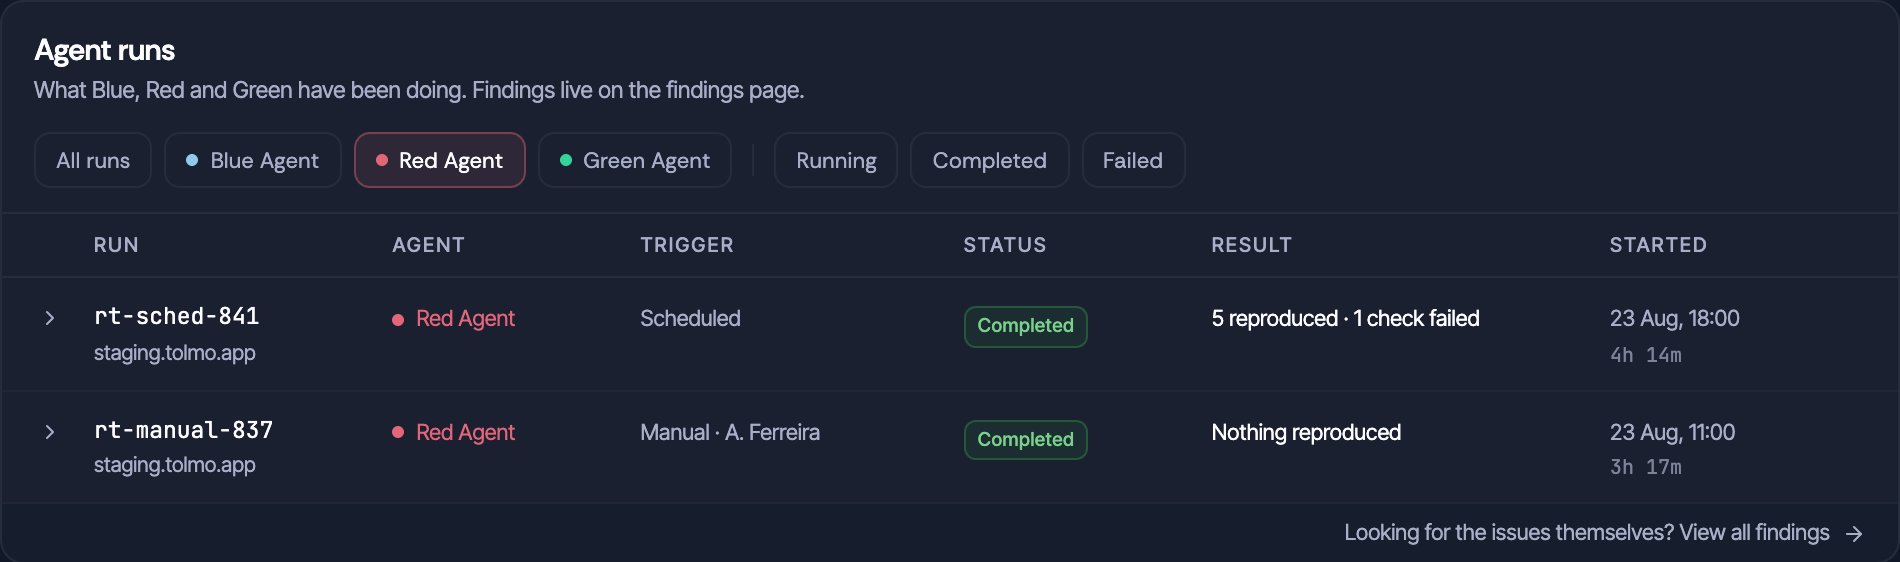 | Column | What it holds |
| ----------- | ----------------------------------------------------------------------------------------------------------------------------------------------------------------- |
| **Run** | The run's id, with the target it ran against underneath. |
| **Trigger** | What set the run off. |
| **Status** | Whether the run finished — **Running**, **Completed**, or **Failed**. |
| **Result** | What it concluded, which is a separate fact from whether it finished: how many issues reproduced, whether a check could not complete, or that nothing reproduced. |
| **Started** | When it began, and how long it took. |
Expand a run to see the findings it touched, by name. A finding is referenced rather than copied, so the same issue crossing Blue, Red, and Green stays one finding with several runs against it. The filter chips at the top switch between agents and statuses, and **All runs** clears them.
A failed check is not a finding. It is a probe that could not complete, which is a gap in coverage rather than a vulnerability — the **Result** column reports it so it does not pass unnoticed.
## Next steps
Create, triage, and update findings with `tolmo findings`.
Download threat model pipeline runs and artifacts.
Still stuck? Email [support@tolmo.com](mailto:support@tolmo.com) and tell us what you were trying to cover.
| Column | What it holds |
| ----------- | ----------------------------------------------------------------------------------------------------------------------------------------------------------------- |
| **Run** | The run's id, with the target it ran against underneath. |
| **Trigger** | What set the run off. |
| **Status** | Whether the run finished — **Running**, **Completed**, or **Failed**. |
| **Result** | What it concluded, which is a separate fact from whether it finished: how many issues reproduced, whether a check could not complete, or that nothing reproduced. |
| **Started** | When it began, and how long it took. |
Expand a run to see the findings it touched, by name. A finding is referenced rather than copied, so the same issue crossing Blue, Red, and Green stays one finding with several runs against it. The filter chips at the top switch between agents and statuses, and **All runs** clears them.
A failed check is not a finding. It is a probe that could not complete, which is a gap in coverage rather than a vulnerability — the **Result** column reports it so it does not pass unnoticed.
## Next steps
Create, triage, and update findings with `tolmo findings`.
Download threat model pipeline runs and artifacts.
Still stuck? Email [support@tolmo.com](mailto:support@tolmo.com) and tell us what you were trying to cover.